Variable Universe
Structured indicators across official statistics, fiscal records, land systems, facilities, places, and satellite-derived activity signals.


A geospatial econometric platform that connects official economic data, municipal finance, administrative records, satellite signals, land systems, places data, and client datasets into one operational model of the economy.
The Spatial Economic Model links economic performance, settlement growth, firm activity, land use, infrastructure access, municipal finance, trade, property, service pressure, and night-light intensity into a shared spatial evidence layer.
Structured indicators across official statistics, fiscal records, land systems, facilities, places, and satellite-derived activity signals.
Nowcasting, accessibility, resilience, fiscal health, investment opportunity, inequality, and spatial growth models.
Comparable spatial outputs for prioritisation, scenario testing, corridor planning, investment cases, and local economic strategy.
The model is designed around data families rather than one-off indicators, so each client engagement can extend the same evidence base with local administrative records, project pipelines, facilities, parcels, and proprietary datasets.
Macro, financial, price, credit, and national accounts context for economic conditions and cycle sensitivity.
Census, community survey, labour, demographic, household, price, enterprise, and official statistical series.
Firm, employment, sector, and local economic activity signals used to understand business geography and momentum.
Municipal financial performance, budgets, spending, revenue, grants, and fiscal health indicators.
Industrial policy, investment, trade, incentives, infrastructure, and sector programme data from national departments.
Administrative records, local registers, permitting, service delivery, assets, facilities, and project pipelines.
Built-up change, population grids, urban expansion, settlement form, land transformation, and land-use classification.
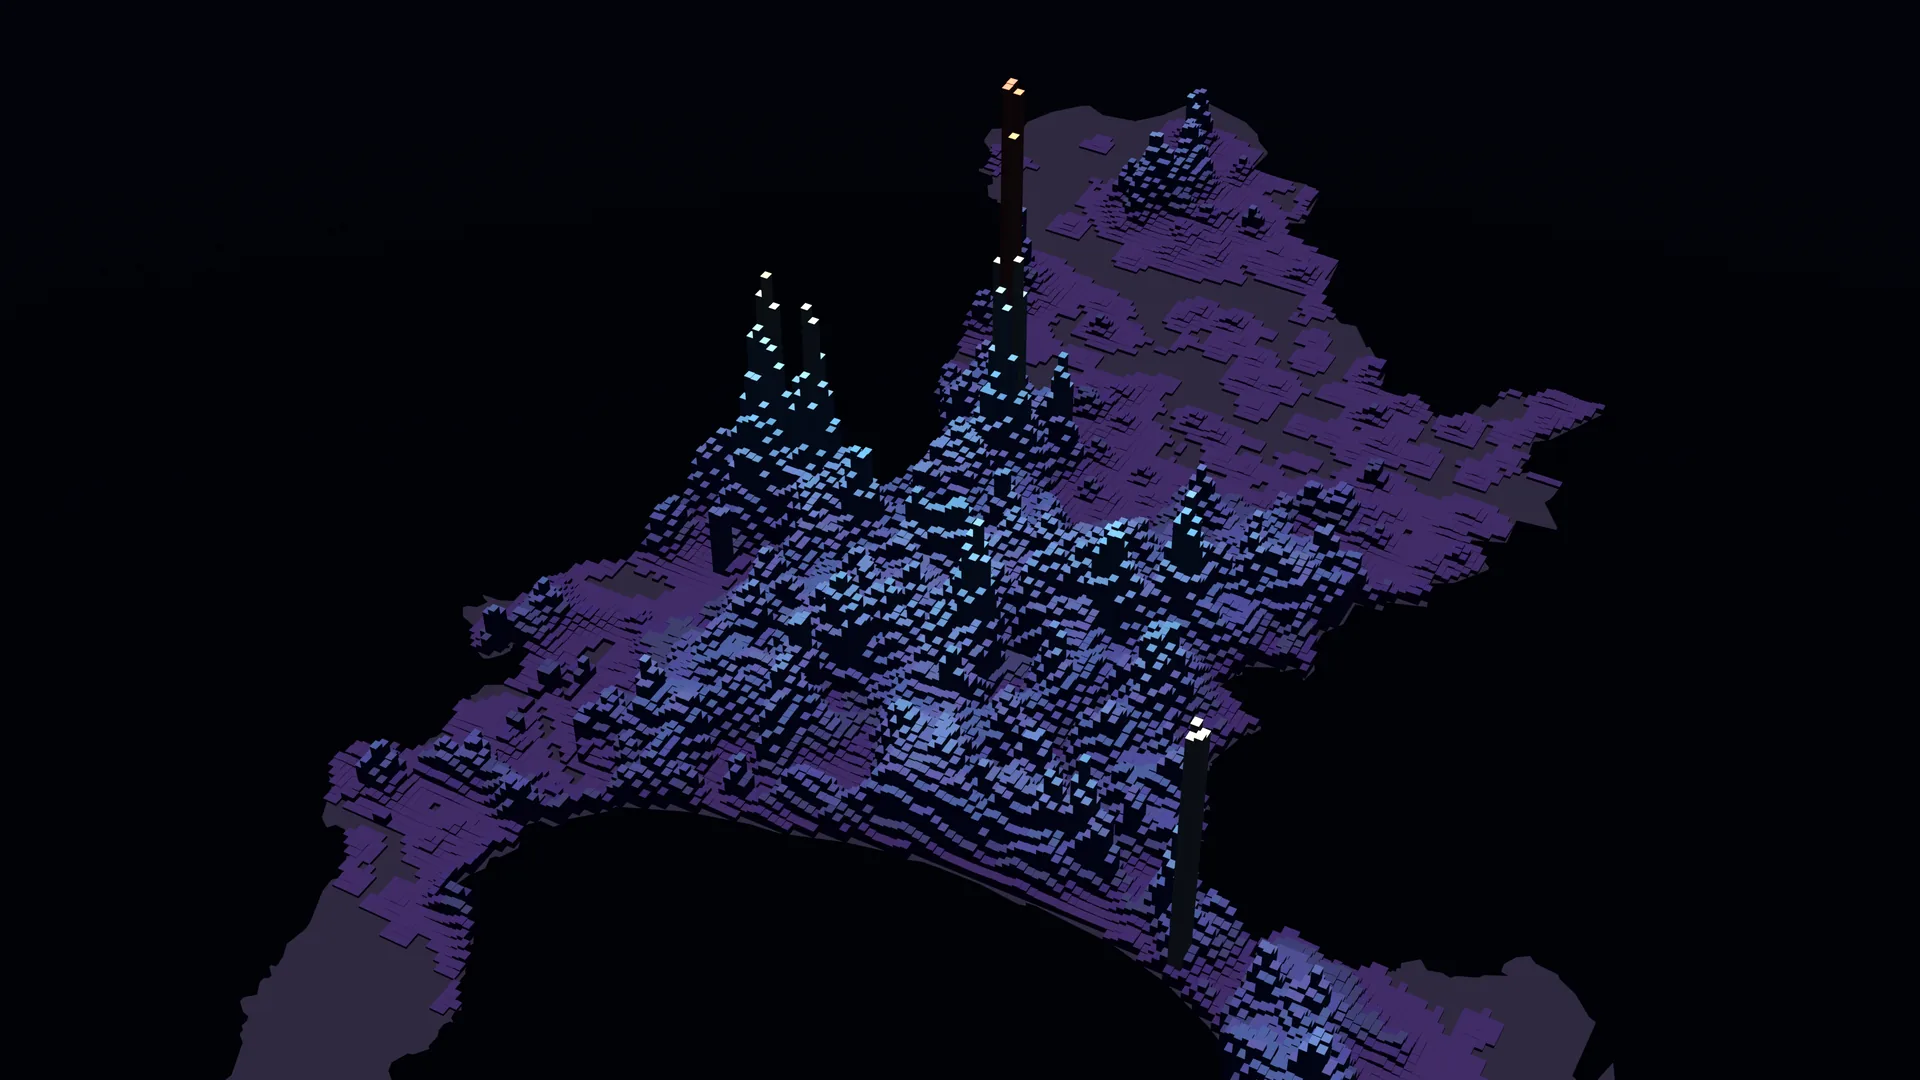
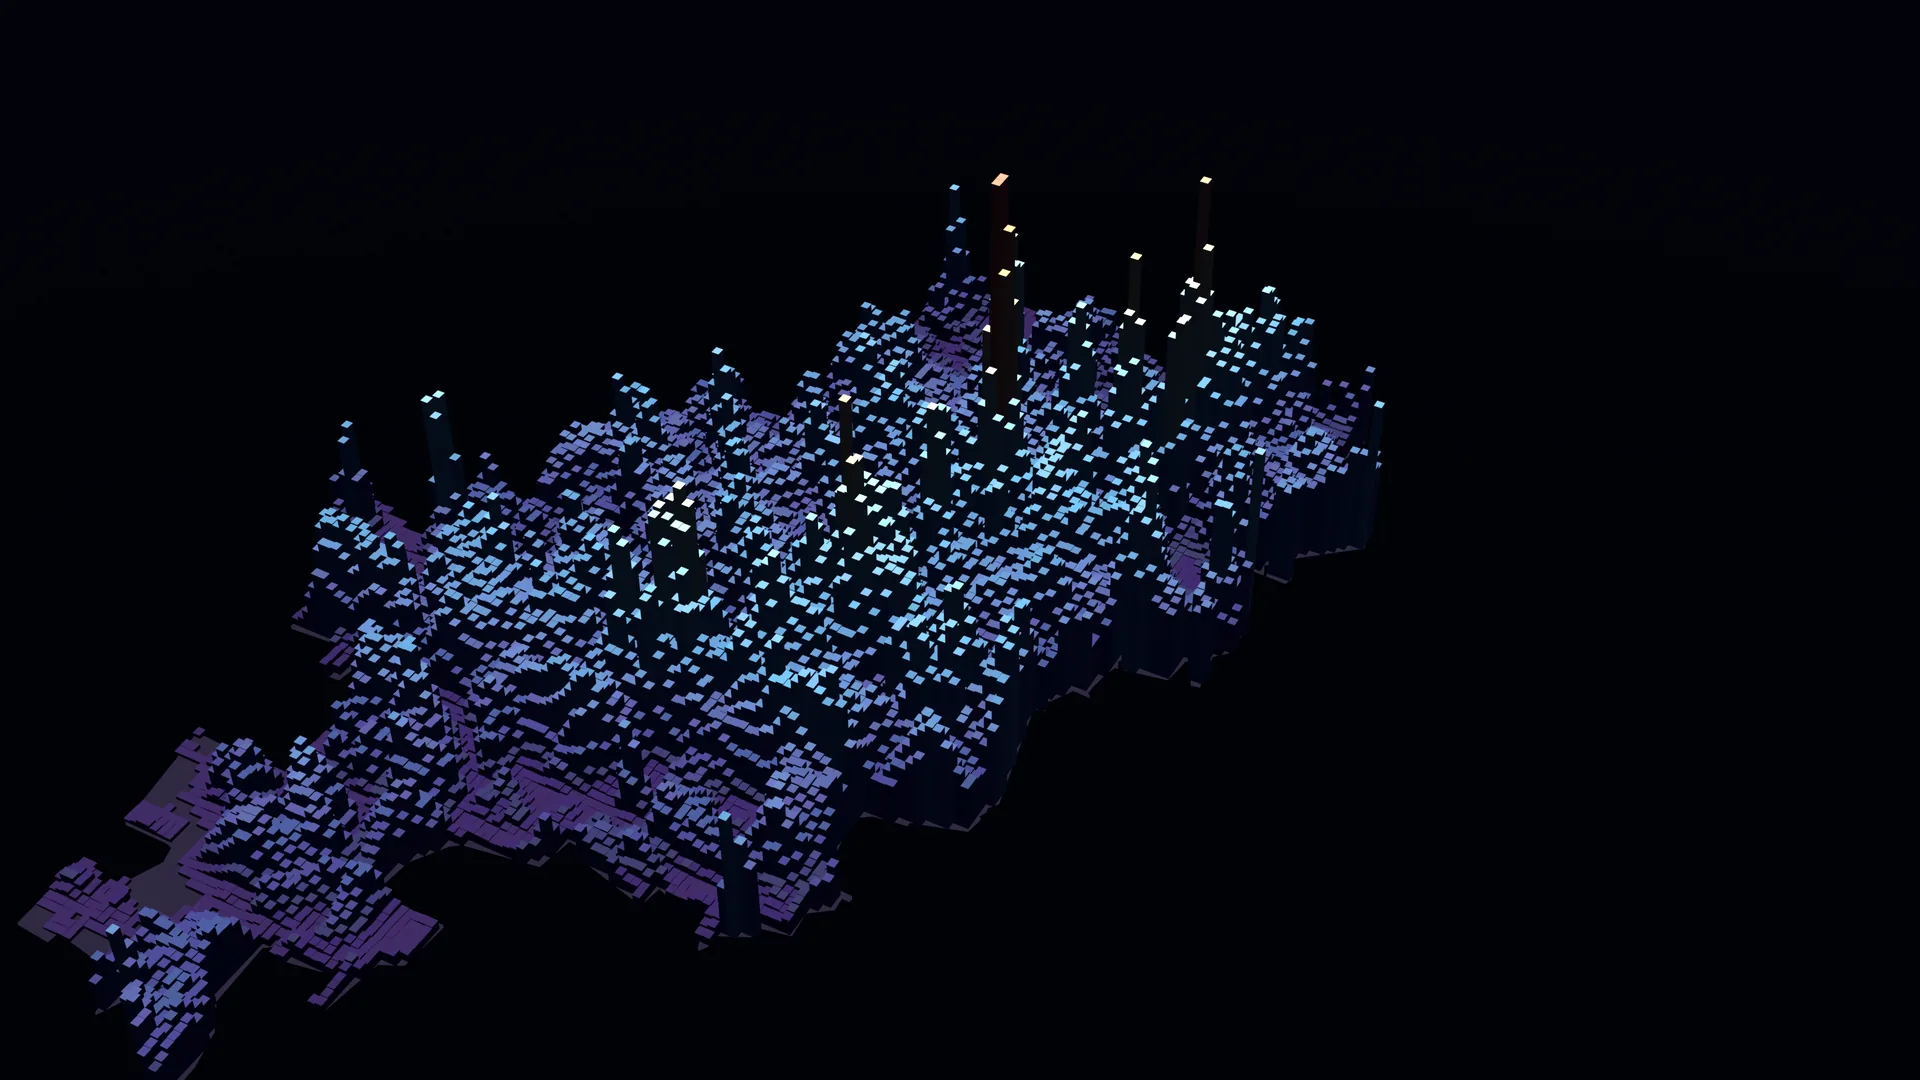
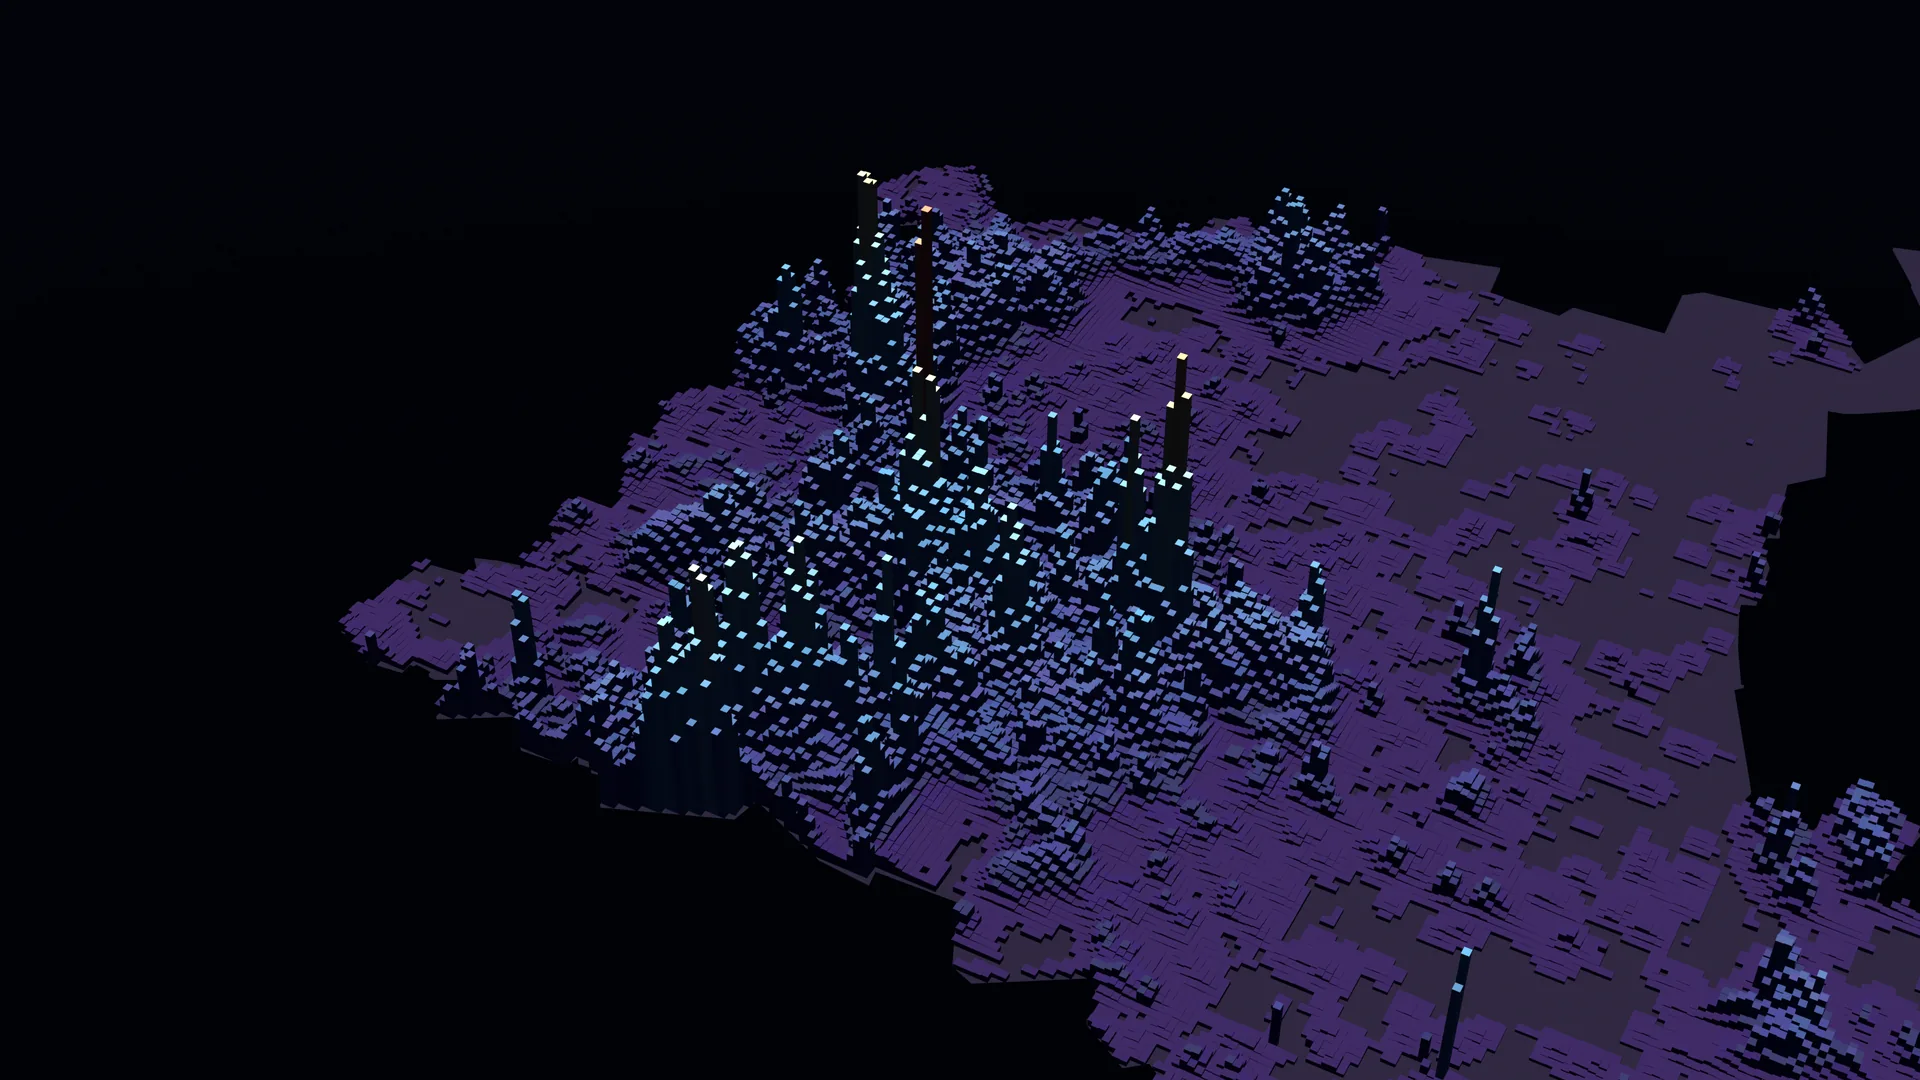
Night-light intensity, growth, decline, anomaly, and activity proxies for high-frequency spatial economic monitoring.
Business locations, amenities, points of interest, customer data, operations data, and client-owned spatial layers.
The platform turns the variable universe into model-ready surfaces: harmonised geographies, comparable time series, source lineage, feature engineering, spatial joins, forecast-ready panels, and explainable outputs for planners, economists, investment teams, and executives.
Connect official, administrative, satellite, places, and client datasets into governed spatial tables.
Align sources across metros, districts, municipalities, wards, hexes, corridors, parcels, and catchments.
Estimate activity, accessibility, sector resilience, property dynamics, fiscal pressure, and investment readiness.
Generate ranked opportunity surfaces, scenario comparisons, evidence packs, and board-ready spatial narratives.
Cape Town leads this local design direction, with the same VIIRS-driven visual and analytical language extending across Johannesburg, Tshwane, and Ekurhuleni.